一. 基本流程
pprof是go的性能分析工具,基本流程为:
- 数据采集。pprof每隔一段时间采集一次被监控程序的运行数据,大约1秒100次,这些数据叫做sample。一个sample中,往往包含函数的堆栈调用,cpu市场,内存消耗等
- 数据输出。数据可以生成到文件中,或者直接通过web服务器远程访问
- 数据分析。利用go tool pprof命令分析数据
pprof采集到的sample数据,一般用于描述特定指标,比如cpu相关的数据,就叫做cpu profile,有以下常见的profile:
- CPU profile:报告程序的 CPU 使用情况,按照一定频率去采集应用程序在 CPU 和寄存器上面的数据
- Memory Profile(Heap Profile):报告程序的内存使用情况
- Block Profiling:阻塞分析,记录 goroutine 阻塞等待同步(包括定时器通道)的位置
- Goroutine Profiling:报告 goroutines 的使用情况,有哪些 goroutine,它们的调用关系是怎样的
- Mutex Profiling:互斥锁分析,报告互斥锁的竞争情况
二. 数据采集
pprof 采样数据是需要被监控的程序代码支持,即被监控的程序中要写入pprof相关代码,主要有三种采集方式:
runtime/pprof
手动调用runtime.StartCPUProfile或者runtime.StopCPUProfile等 API来生成和写入采样文件,灵活性高。
这种方式适合对单独的Application进行采用,示例代码如下:
import "runtime/pprof"

pprof.StartCPUProfile(f)
defer pprof.StopCPUProfile()
net/http/pprof
通过 http 服务获取Profile采样文件,简单易用,适用于对应用程序的整体监控。通过 runtime/pprof 实现。
这种方式适合于采集长期运行的服务器数据,必须要开启一个http端口,示例代码如下:
 _ "net/http/pprof"

http.ListenAndServe("0.0.0.0:6060", nil)
go test
通过 go test -bench . -cpuprofile prof.cpu生成采样文件
这种方式适用对函数进行针对性测试
三. 数据输出
- 通过runtime/pprof和go test采集的数据,都会直接生成对应的prof二进制文件。
- 通过net/http/pprof采集的数据,可以直接通过URL访问
http://localhost:port/debug/pprof/
也可以将其保存为二进制文件
curl http://localhost:port/debug/pprof/heap > heap.out
四. 数据分析
数据样本采用go tool pprof分析,一般两种分析方式
1. 直接分析prof二进制文件
go tool pprof [binary.prof]
2. 直接连入开启pprof的程序分析
# 如果使用的 net/http/pprof 可以直接接 URL
go tool pprof http://localhost:6060/debug/pprof/profile
五. 分析技巧
我们以cpu的profile为例 ,说明一些pprof使用技巧。
1. 命令行模式和web模式
go tool pprof在使用的时候,常用命令行模式和web模式。
命令行模式在快速查看的时候很有用。
$ go tool pprof xx.prof.gz
File: xxx
Type: cpu
Time: Feb 14, 2022 at 4:34pm (CST)
Duration: 600.20s, Total samples = 1080.17s (179.97%)
Entering interactive mode (type "help" for commands, "o" for options)
(pprof)
常见的命令有:
- help。查看帮助
- top。查看最耗时的函数
- list。通过list+函数名,可以查看函数内部的详细消耗
web模式适用于大多数场景,通过命令可以生成一个web站点,展示pprof的所有信息:
go tool pprof --http localhost:9090 xxx.prof
2. top信息
(pprof) top
Showing nodes accounting for 504.79s, 46.73% of 1080.17s total
Dropped 2145 nodes (cum <= 5.40s)
Showing top 10 nodes out of 329
      flat  flat%   sum%        cum   cum%
   149.11s 13.80% 13.80%    155.43s 14.39%  runtime.findObject
    67.29s  6.23% 20.03%    326.37s 30.21%  runtime.scanobject
    64.58s  5.98% 26.01%     64.91s  6.01%  runtime.cgocall
    56.89s  5.27% 31.28%     56.89s  5.27%  runtime.markBits.isMarked (inline)
    32.98s  3.05% 34.33%    164.09s 15.19%  runtime.mallocgc
top用于展示最消耗cpu的函数:
- flat。表示本次采样过程中,该函数一共消耗了多少秒CPU。这个是最关键的指标,比如例子中runtime.findObject一共消耗了149.11s cpu。我们一般看flat,就知道哪个函数最消耗CPU
- flat%。表示本次采样的总时长中,本函数的flat消耗比例。比如例子中采样总共消耗的CPU时长为1080.17s,则runtime.findObject函数的flat%=149.11/1080.17=13.8%
- sum%。表示几个函数的flat%之和。比如第一个函数runtime.findObject,sum%=flat%=13.8%。第二个函数runtime.scanobject的sum%,等于第一个函数的flat%加本函数的flat%,即sum%=13.8%+6.23=20.03%。依次类推。sum%的作用快速定位消耗CPU的一群函数。比如例子中,我们知道前5个函数,一共就消耗了本次采样总时长中34.33%的CPU。
- cum,cum%和flat, flat%概念是差不多的,但是cum中包含了本函数自身指令执行时长,以及调用子函数的指令时长的总和
cum和flat的区别
假如有这么一个函数foo:
func foo(){
    a()                                 step1
    b()                                 step2
    do something directly.              step3
    c()                                 step4
}
- flat是不包括子函数的,即flat=step3的执行时间
- cum是包括所有的,即cum=step1+step2+step3+step4总共执行时间
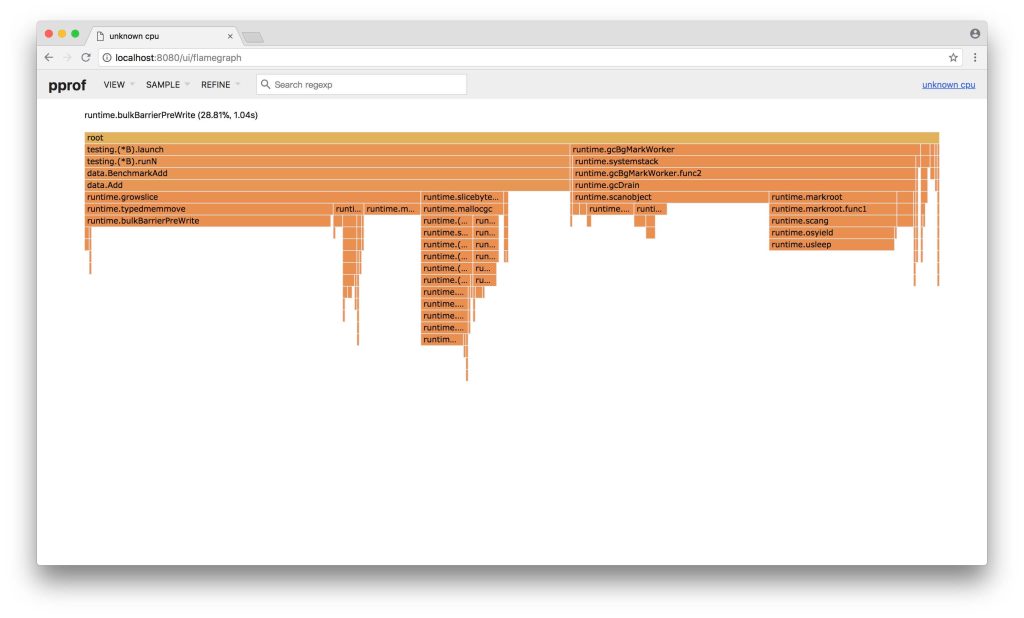
3. 火焰图
web模式的页面中,可以看见火焰图,火焰图非常的好用,显示了调用堆栈和对应的时常,每一块代表一个函数,越大代表占用 CPU 的时间更长。同时它也支持点击块深入进行分析!
4. Graph
除了火焰图,Graph也具有一定的参考价值。Graph格式如下:
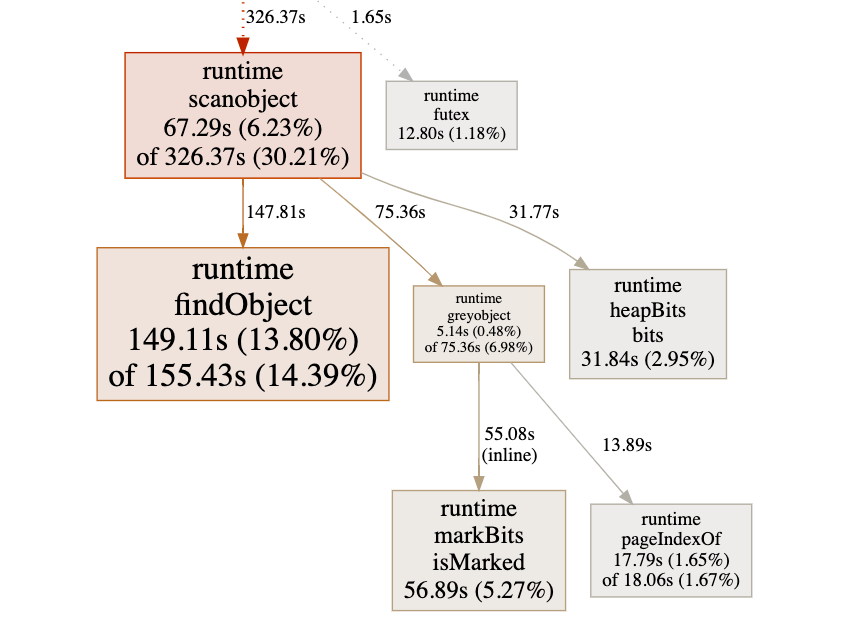
- 方框:函数
- 方框尺寸:尺寸越大,消耗越大
- 箭头:X调用Y
- 线条:记录了X调用Y的次数或时长。数字越大,线条越粗。
- 方框第一行数字:Flat (Flat%)
- 方框第二行数字:Cum (Cum%)。对比top数据,发现二者是相等的
flat  flat%   sum%        cum   cum%
149.11s 13.80% 13.80%    155.43s 14.39%  runtime.findObject
Ref
- https://go.dev/blog/pprof
- https://stackoverflow.com/questions/32571396/pprof-and-golang-how-to-interpret-a-results
回复 Thomas Liu 取消回复